Rent Manager AI dashboards: the prompt and the result
Connect AskRentAI to Claude, ChatGPT or Grok, ask for a dashboard or chart in plain English, and your AI app draws it from your Rent Manager data. Below, each example shows the exact prompt next to its result. Copy a prompt and try it on your own portfolio.
Dashboards are included with AskRentAI at $10 per user per month plus the AI app you already use (Claude, ChatGPT or Grok). There is no separate BI or dashboard product to pay for, so you don't need a tool like Power BI to get them.
AskRentAI connects your AI app to your Rent Manager database. When you ask a question, the records needed to answer it are sent to the AI tool, and the AI app does the rest, including drawing the chart. AskRentAI supplies the data; it does not make the charts. For a rent manager AI setup that works with the assistant you already use, see Rent Manager AI: Orion vs connecting Claude or ChatGPT.
About these examples. Each image was drawn by an AI app. Every name and figure in them is fictional sample data, not a real portfolio.
Examples
Executive KPI dashboard
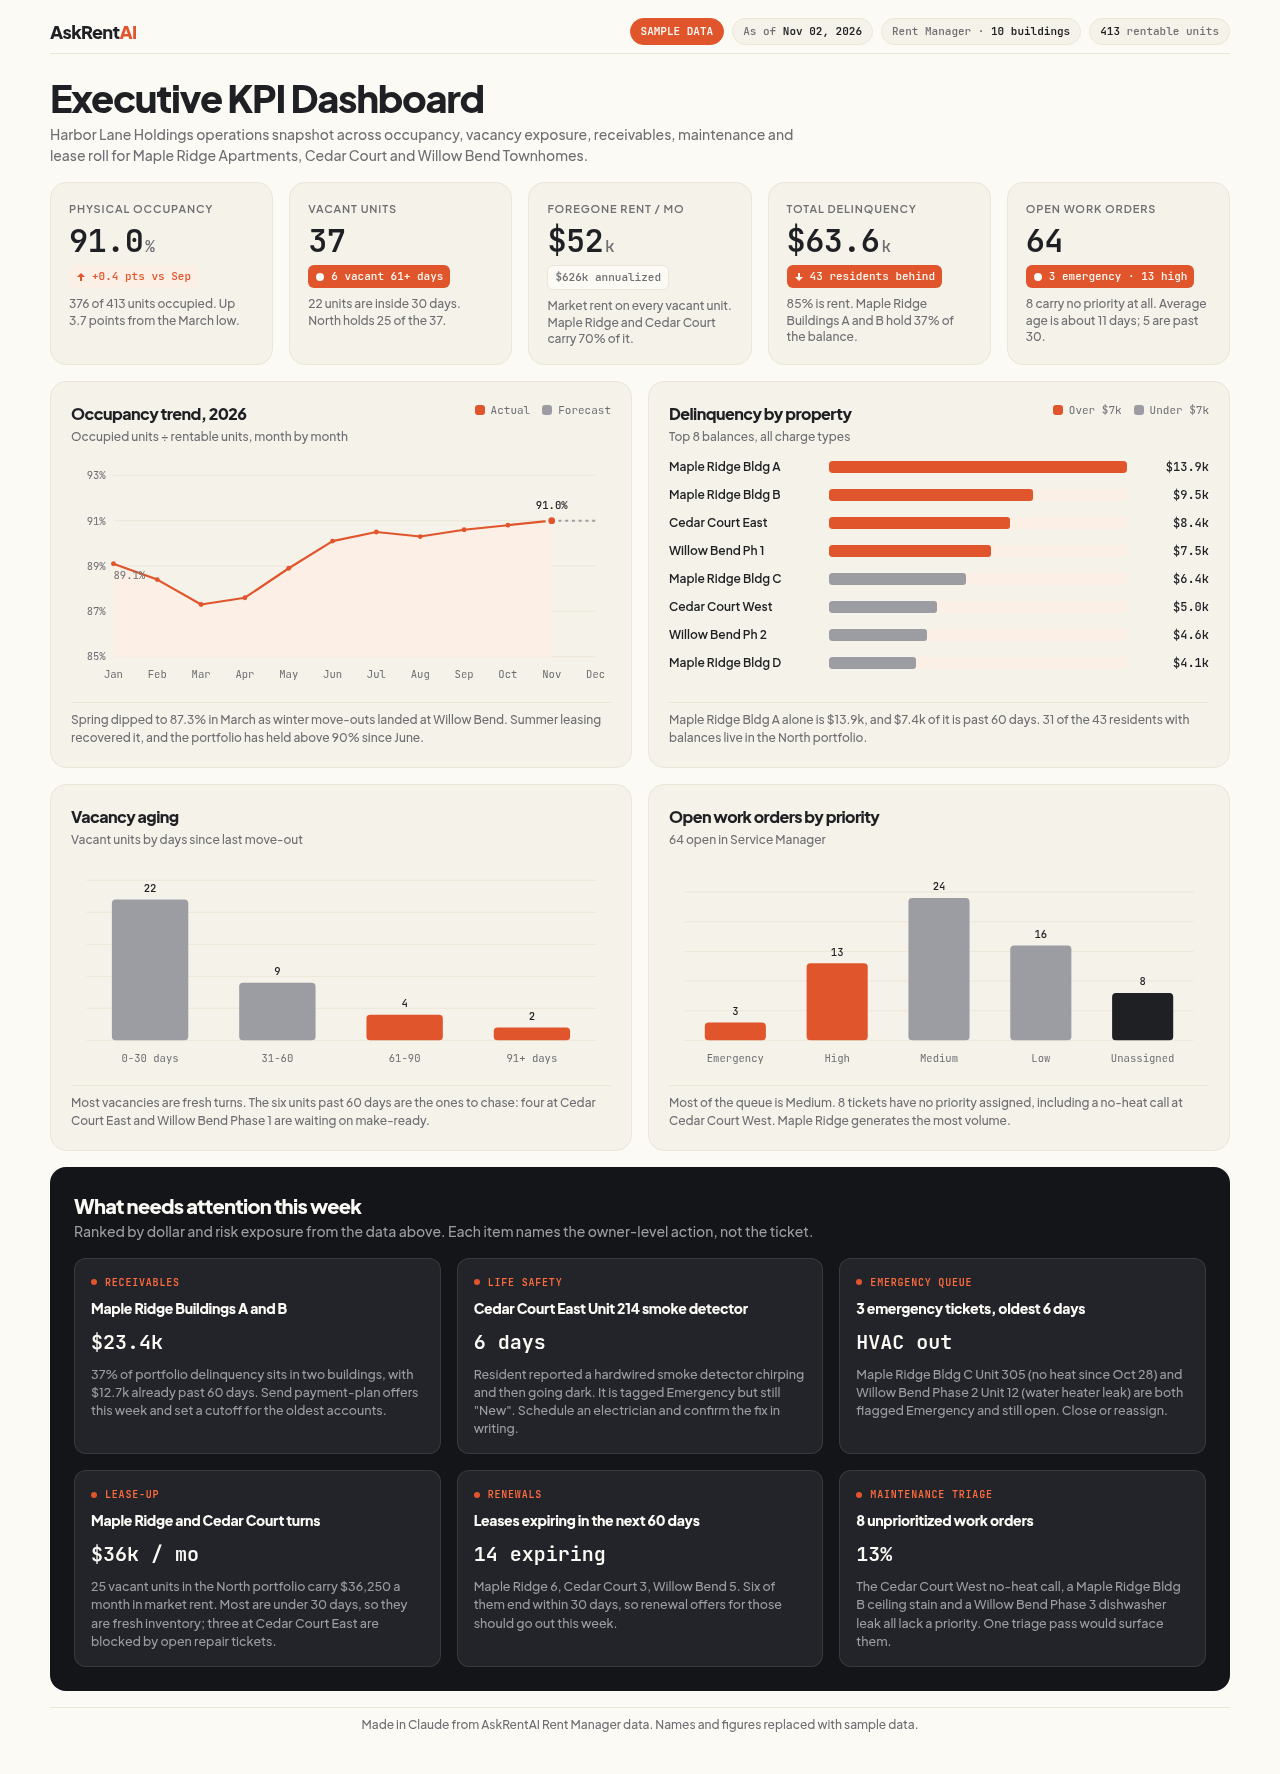
An executive dashboard covering occupancy, vacant units and foregone rent, delinquency, open work orders by priority and leases expiring soon, with a panel on what needs attention this week. Claude drew it; AskRentAI supplied the Rent Manager data.
Exact prompt (plus an AskRentAI style block)
Using my AskRentAI Rent Manager data, design a stunning executive KPI dashboard as a single-file HTML artifact. Pull real numbers for occupancy, vacant units and foregone rent, total delinquency, open work orders by priority, and leases expiring in the next 60 days. Make it look like a premium SaaS product: clean typography, KPI cards with trend indicators, and 3-4 polished charts. Add a short 'What needs attention this week' panel based on the data.
Made in ClaudeSample data
Ghost Receivables: one non-obvious insight
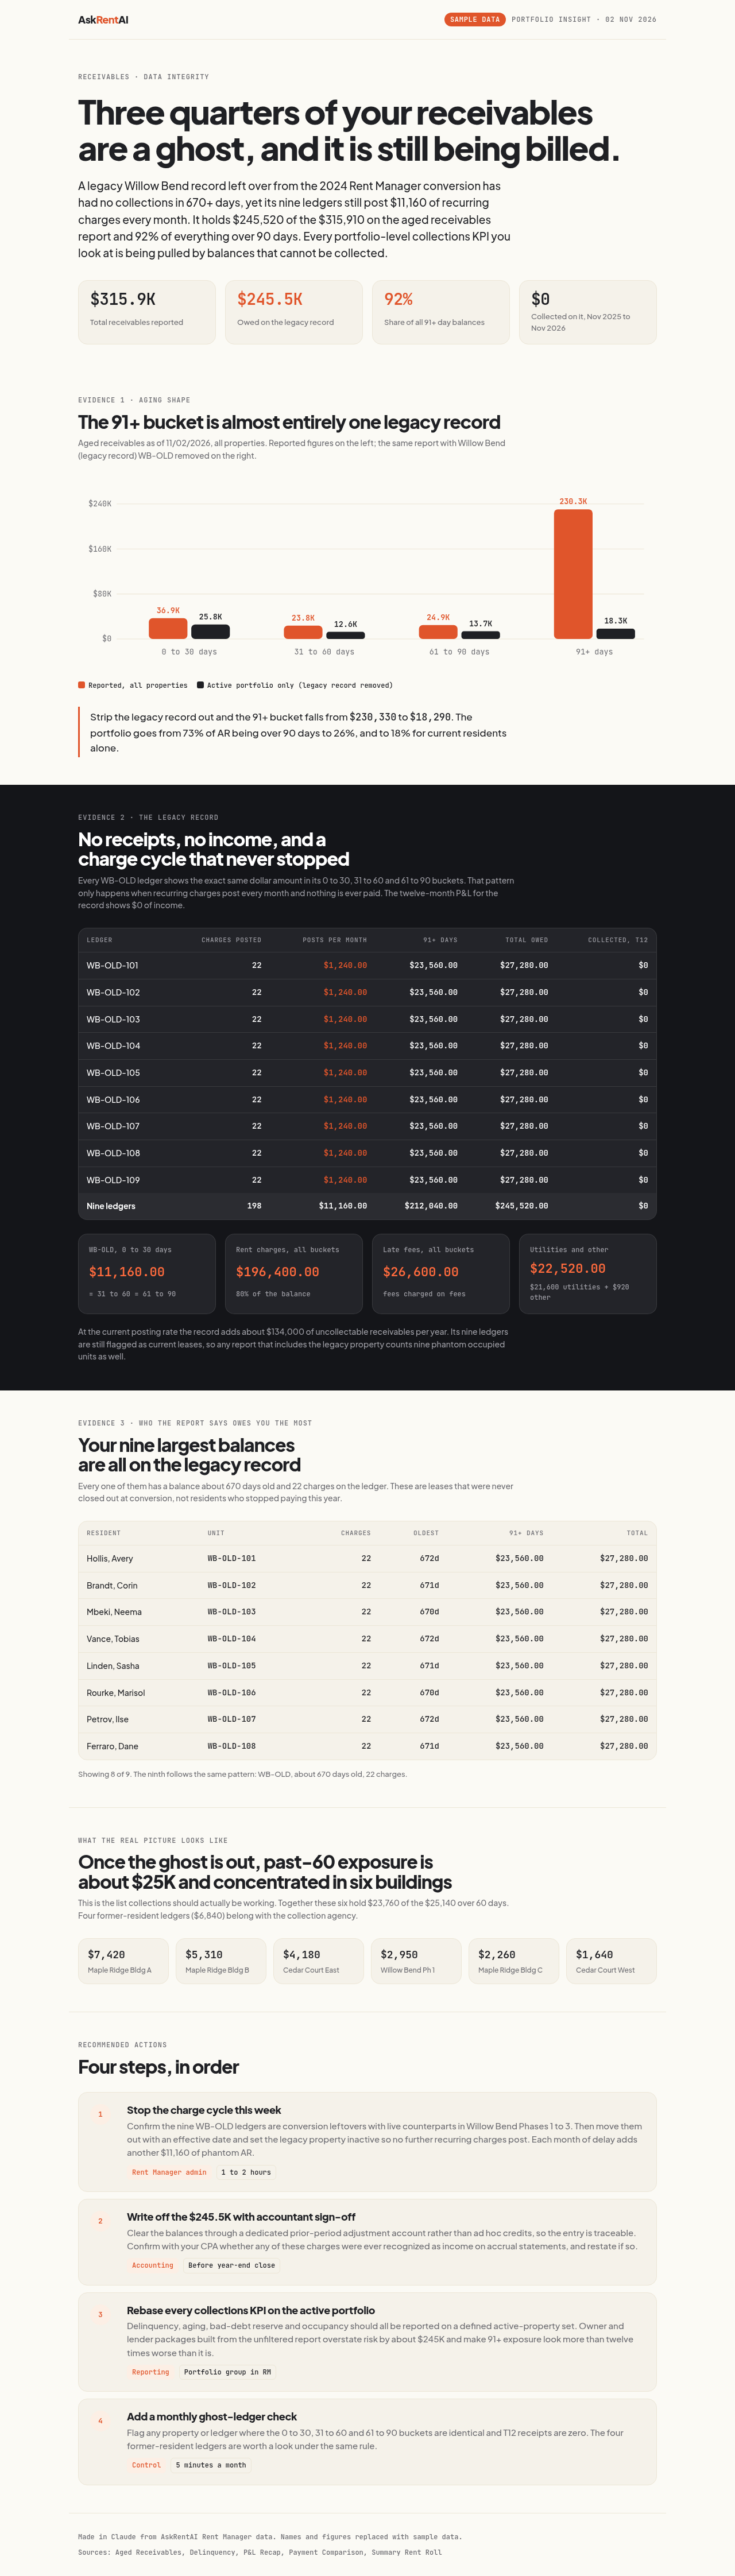
An open-ended prompt: ask Claude to find one non-obvious, important insight in your portfolio and tell the story with evidence and recommended actions. Claude drew it; AskRentAI supplied the Rent Manager data.
Exact prompt (plus an AskRentAI style block)
Using my AskRentAI Rent Manager data, dig in and find one non-obvious, important insight about my portfolio that I probably haven't noticed, and present it as a beautifully designed single-page HTML artifact that tells the story with evidence and recommended actions.
Made in ClaudeSample data
Portfolio health map
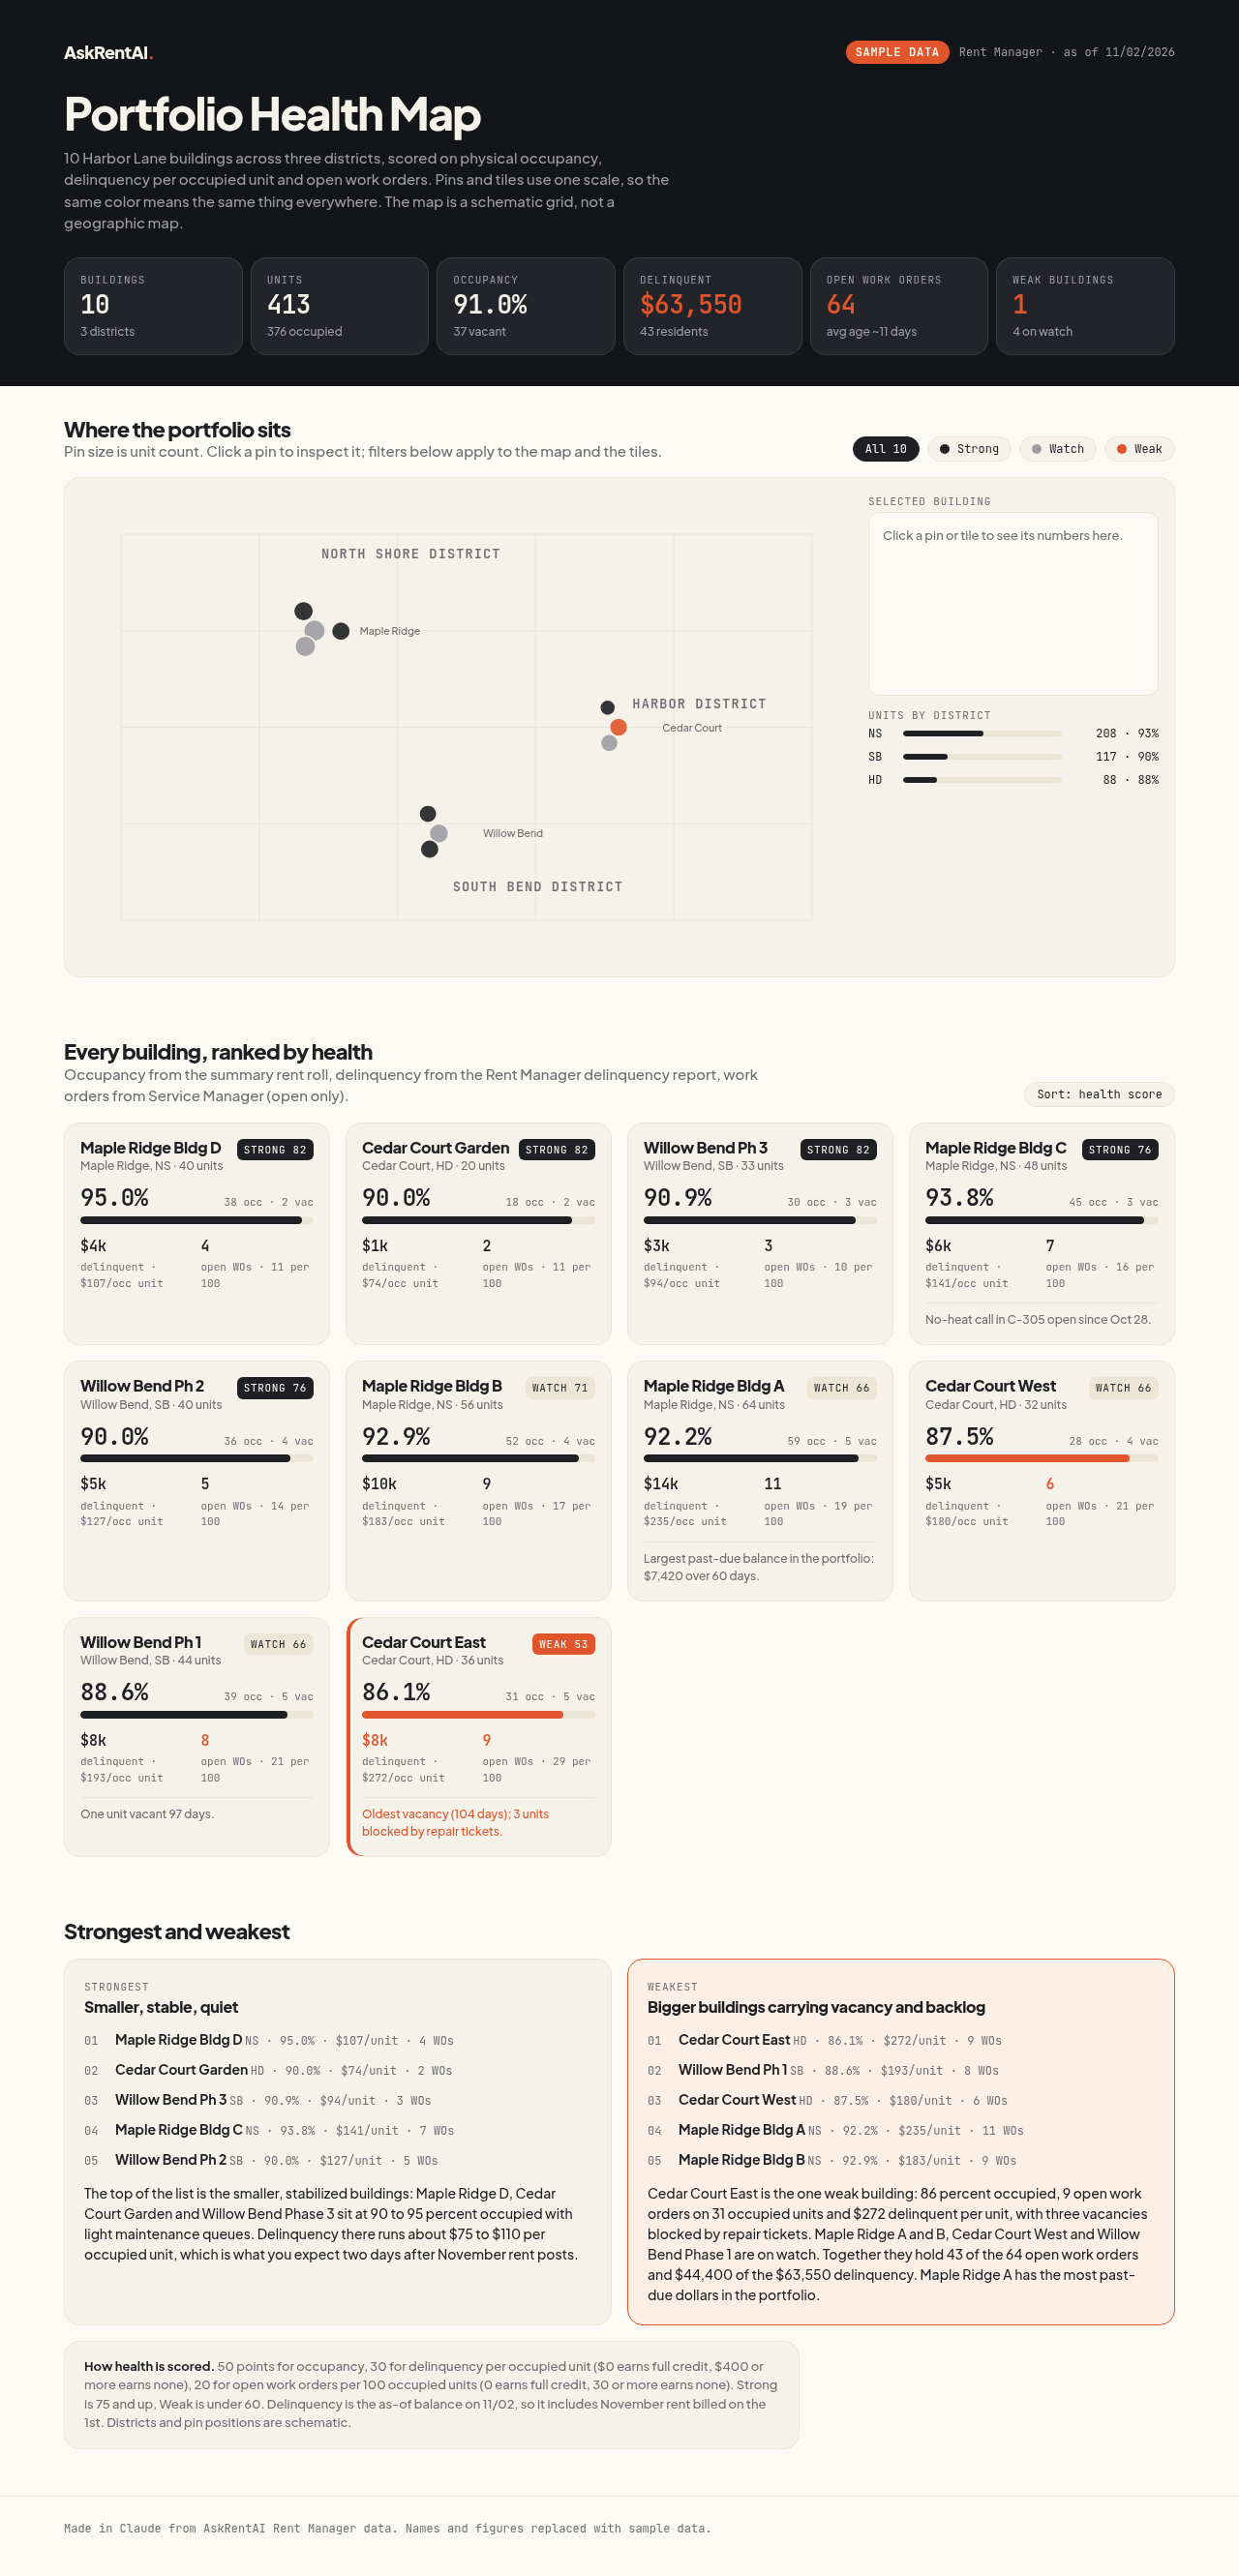
Each property as a pin and tile with occupancy, delinquency and open work orders, color-coded by health, with a summary of the strongest and weakest properties. The map is a schematic grid, not a geographic map.
Exact prompt (plus an AskRentAI style block)
Using my AskRentAI Rent Manager data, create a beautiful portfolio map-style overview as an HTML artifact: each property as a tile or pin with occupancy, delinquency and open work orders, color-coded by health, plus a short summary of the strongest and weakest properties.
Made in Claude (minor fix applied)Sample data
More examples made in Claude
Monthly owner report
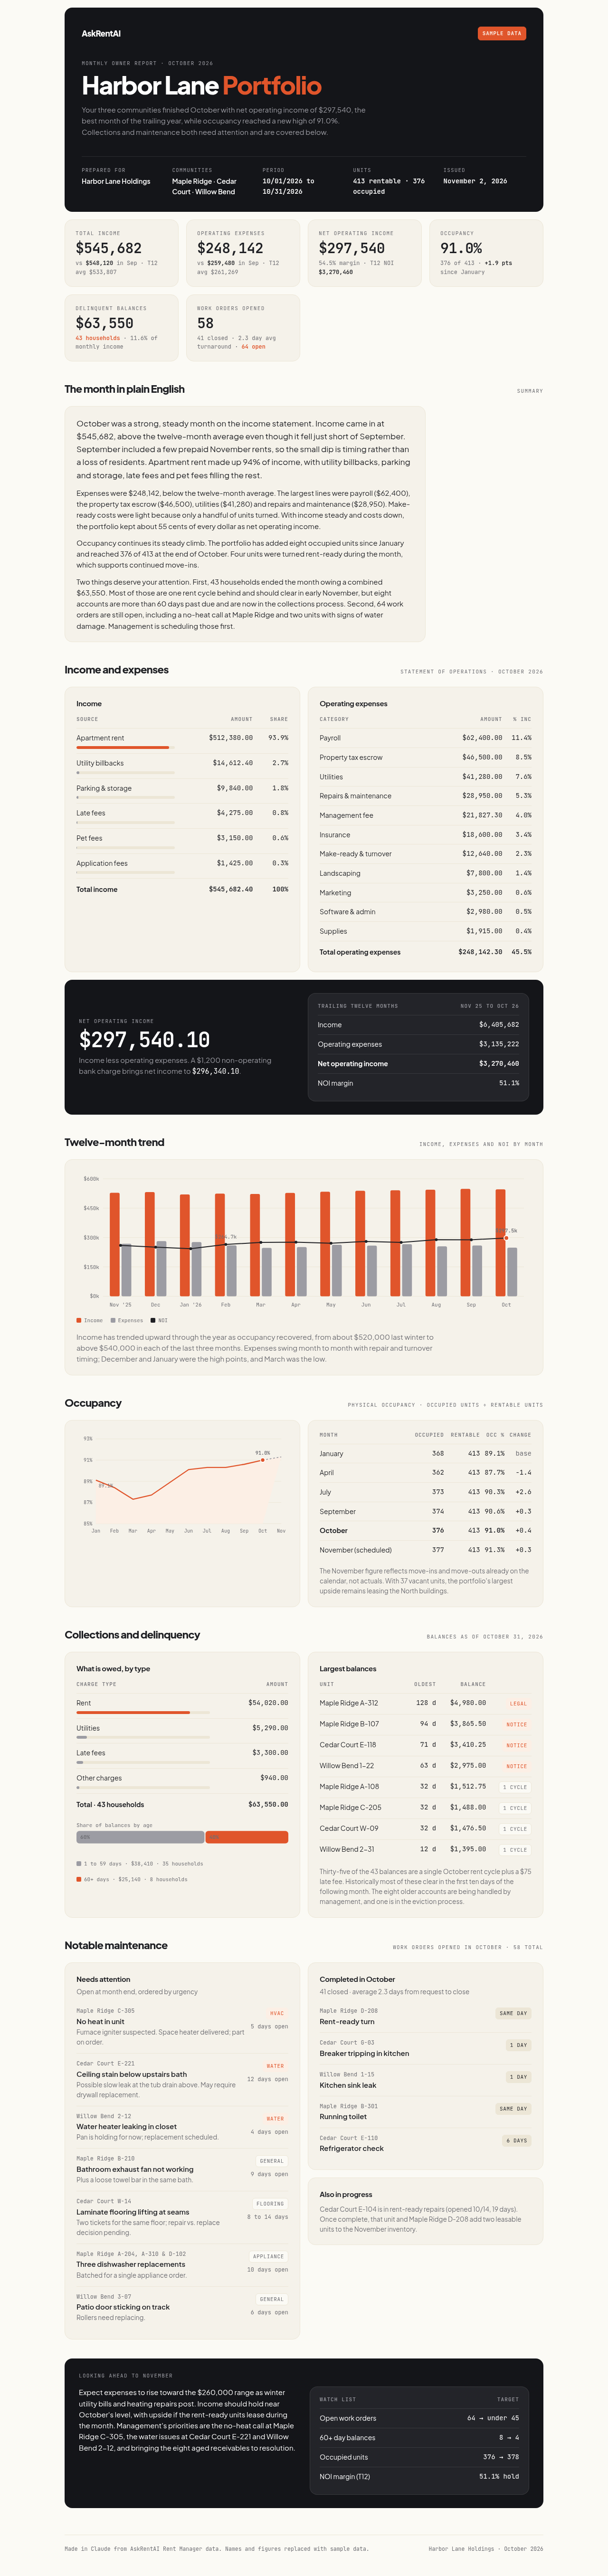
A monthly owner report styled like an investment statement, with income and expense summary, NOI, occupancy, delinquency and notable maintenance.
Exact prompt (plus an AskRentAI style block)
Using my AskRentAI Rent Manager data, create a beautiful monthly owner report for one of my owners as an HTML artifact, styled like a high-end investment statement: cover header, income and expense summary, NOI, occupancy, delinquency and notable maintenance, with elegant charts and a plain-English summary an owner would enjoy reading.
Made in ClaudeSample data
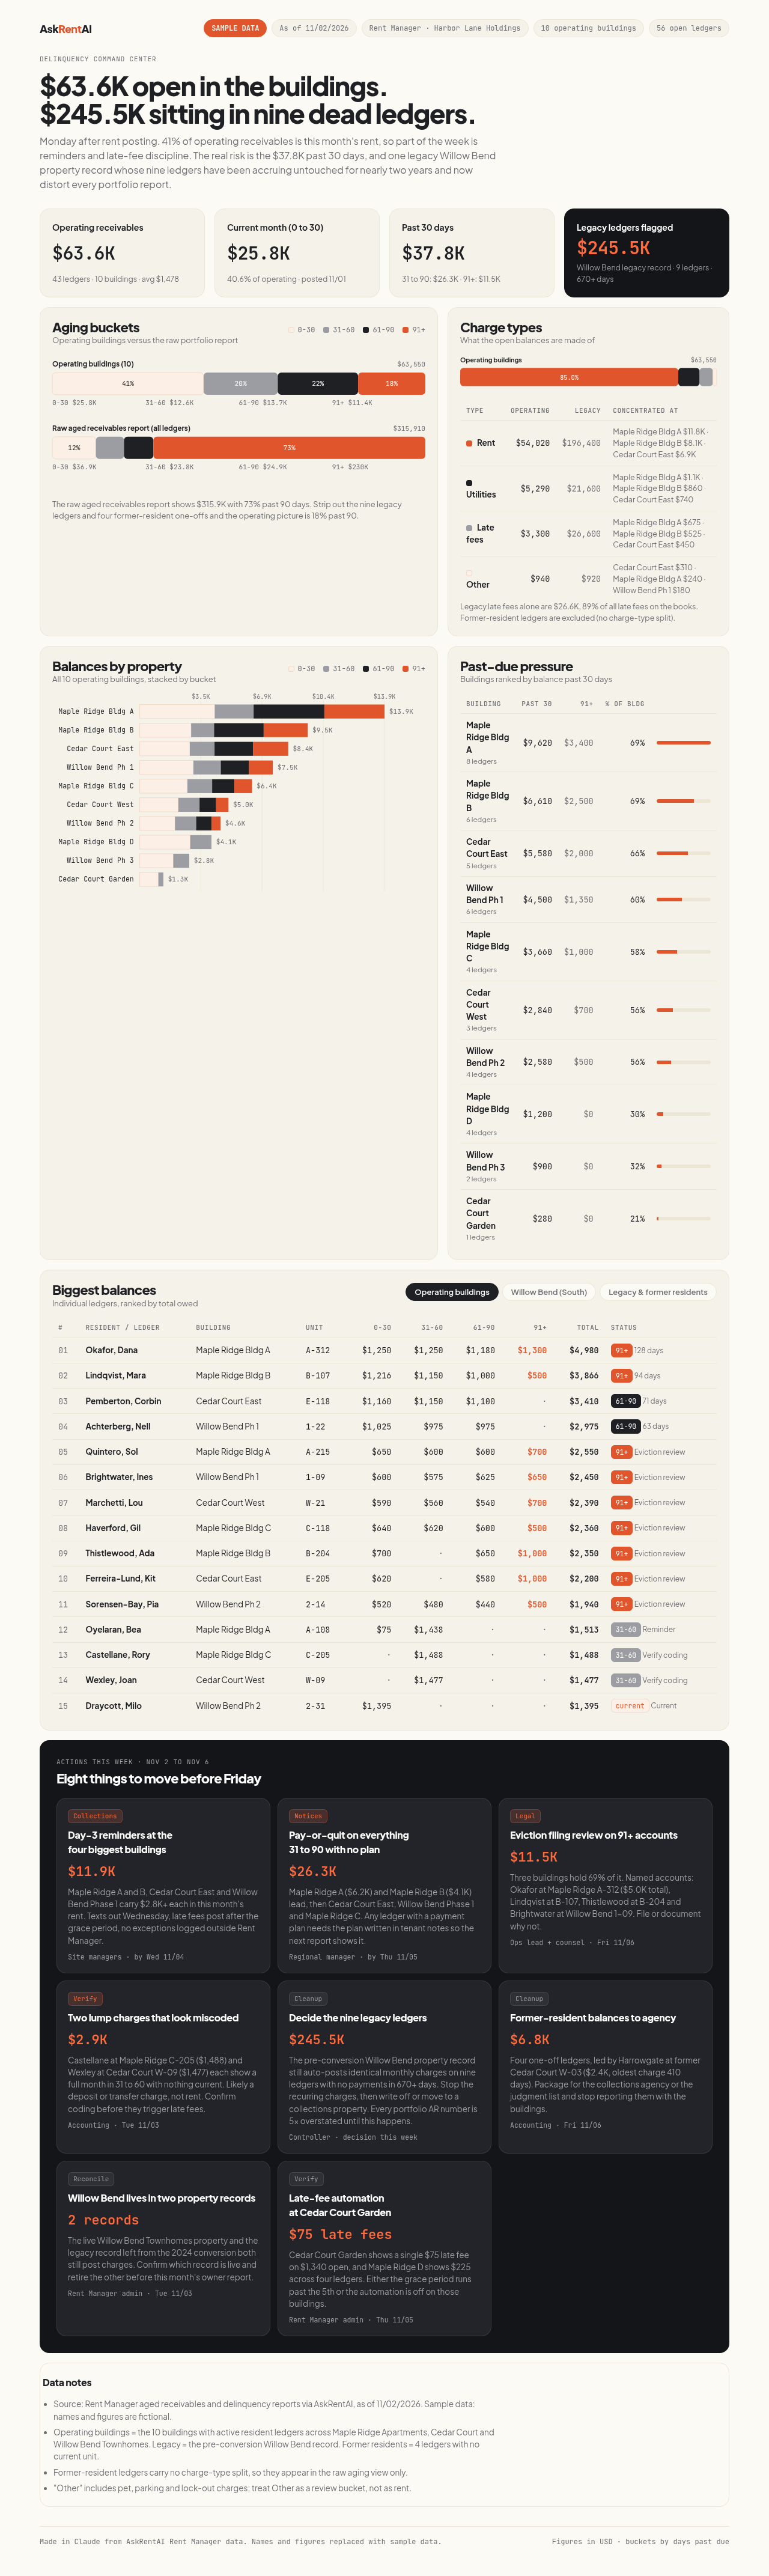
Delinquency command center
Aging buckets, balances by property, the biggest balances, charge types and actions for the week. See also the Rent Manager delinquency report guide.
Exact prompt (plus an AskRentAI style block)
Using my AskRentAI Rent Manager data, build a delinquency command center as a single-file HTML artifact: aging buckets, balances by property, the biggest balances, charge types, and the actions to take this week, with polished charts and tables.
Made in ClaudeSample data
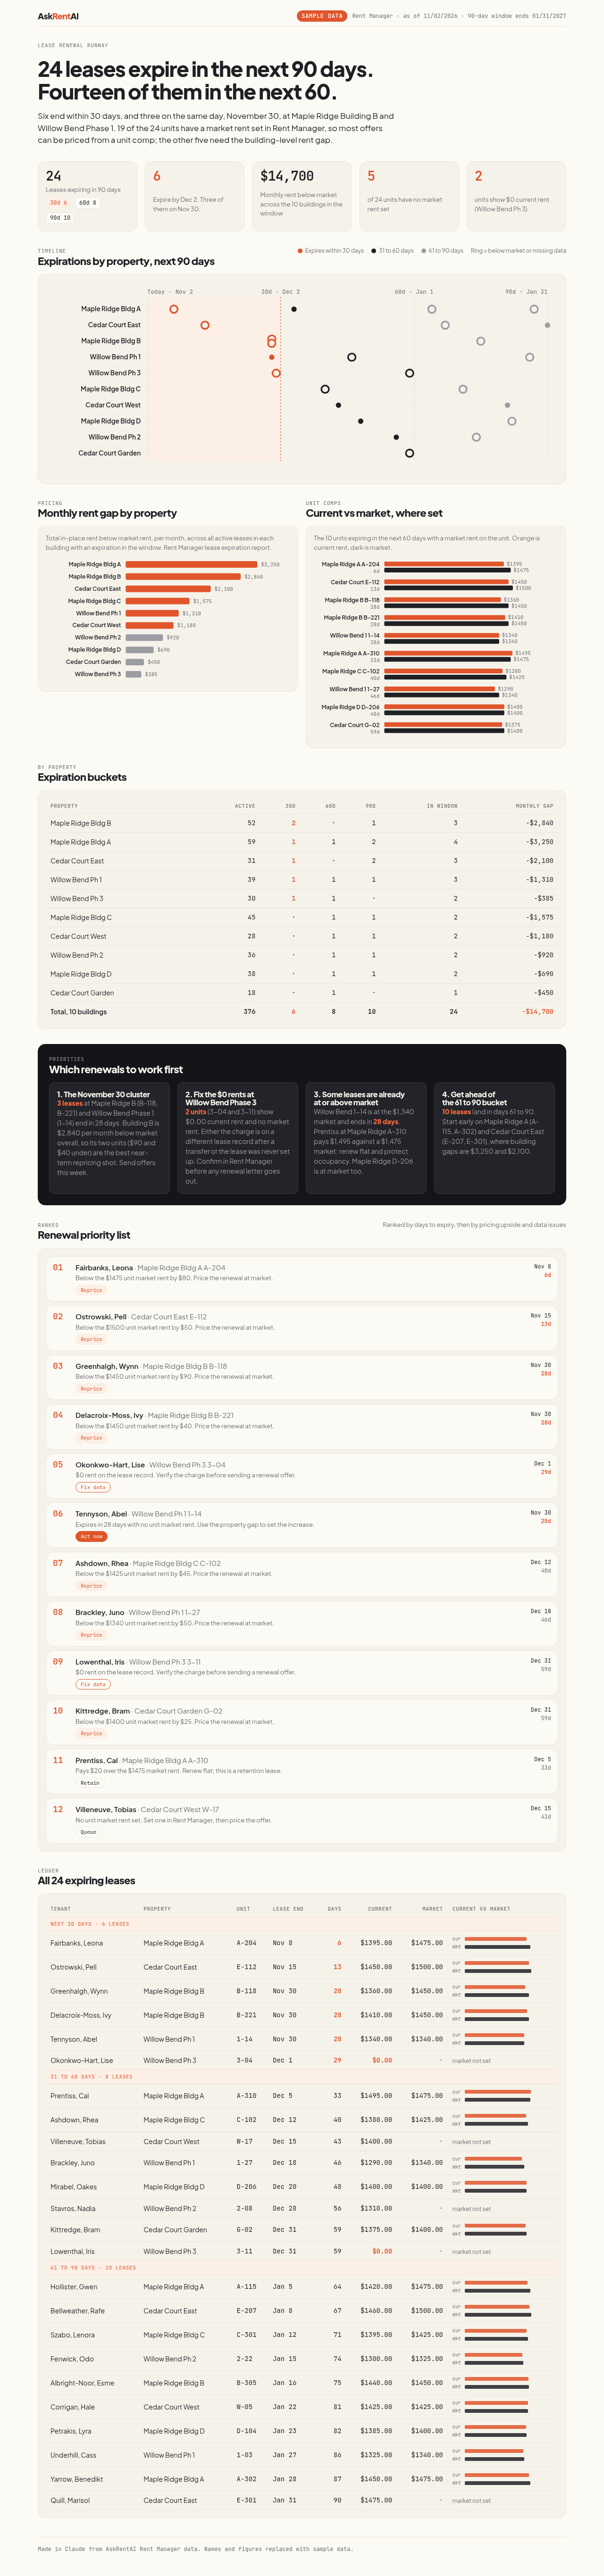
Lease renewal runway
Leases expiring in the next 30, 60 and 90 days by property, current rent against market, and which renewals to prioritize, on a timeline. See also the lease expiration report guide.
Exact prompt (plus an AskRentAI style block)
Using my AskRentAI Rent Manager data, build a lease renewal runway as an HTML artifact: leases expiring in the next 30, 60 and 90 days by property, current rent vs market, and which renewals to prioritize, with a clear timeline visual.
Made in Claude (minor fix applied)Sample data
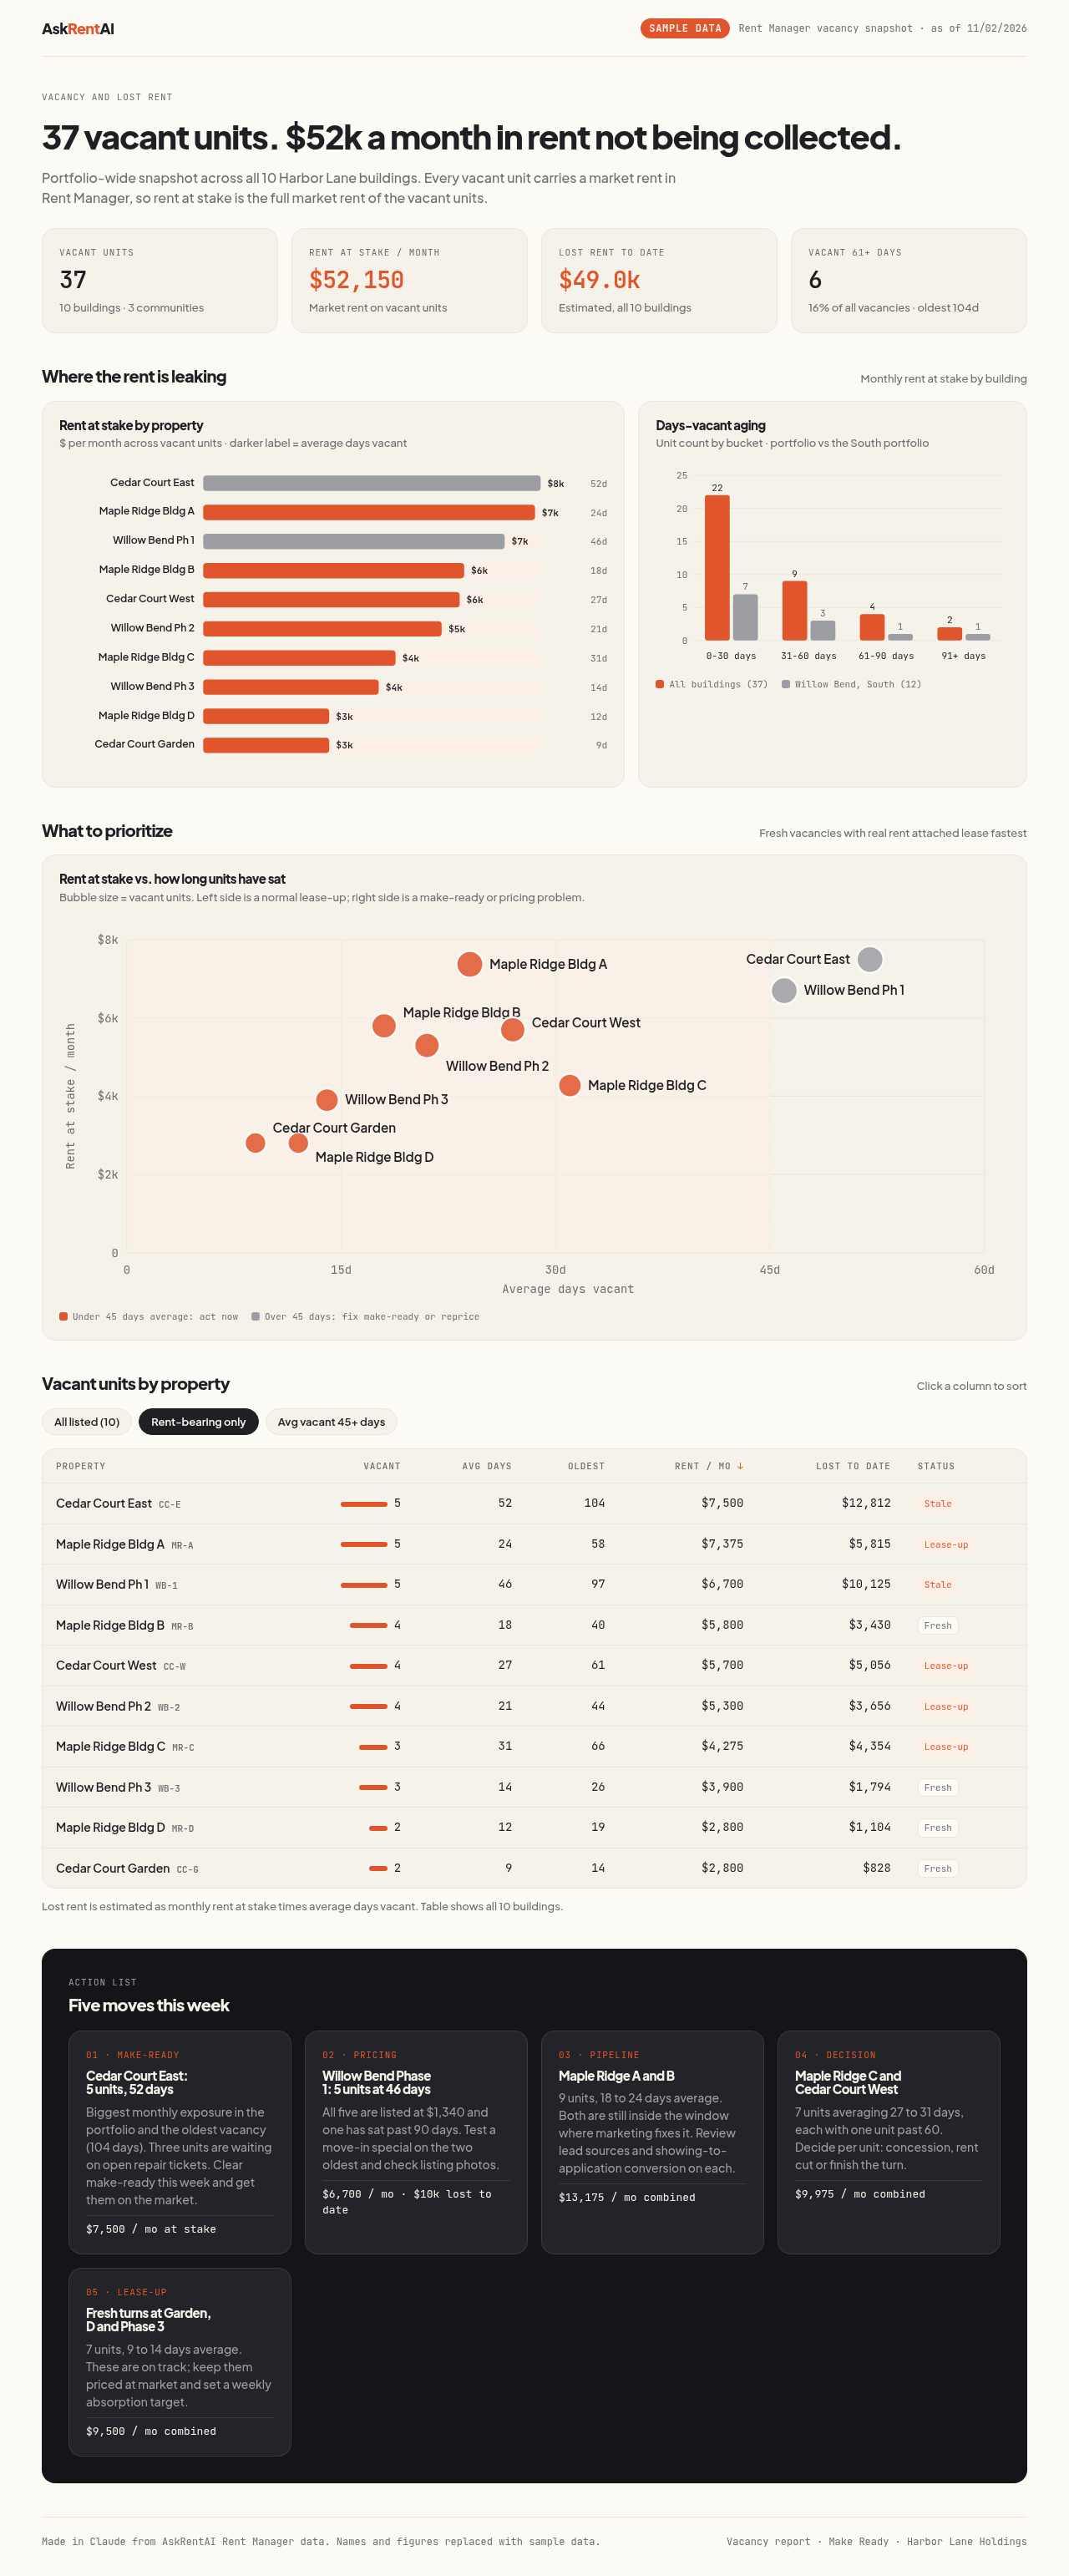
Vacancy and lost-rent dashboard
Vacant units by property, days vacant, rent lost to date and which vacancies to prioritize, with a short action list.
Exact prompt (plus an AskRentAI style block)
Using my AskRentAI Rent Manager data, design a polished vacancy and lost-rent dashboard as a single-file HTML artifact: vacant units by property, days vacant, rent lost to date, and which vacancies to prioritize, with refined charts and a short action list.
Made in Claude (minor fix applied)Sample data
Charts from Grok
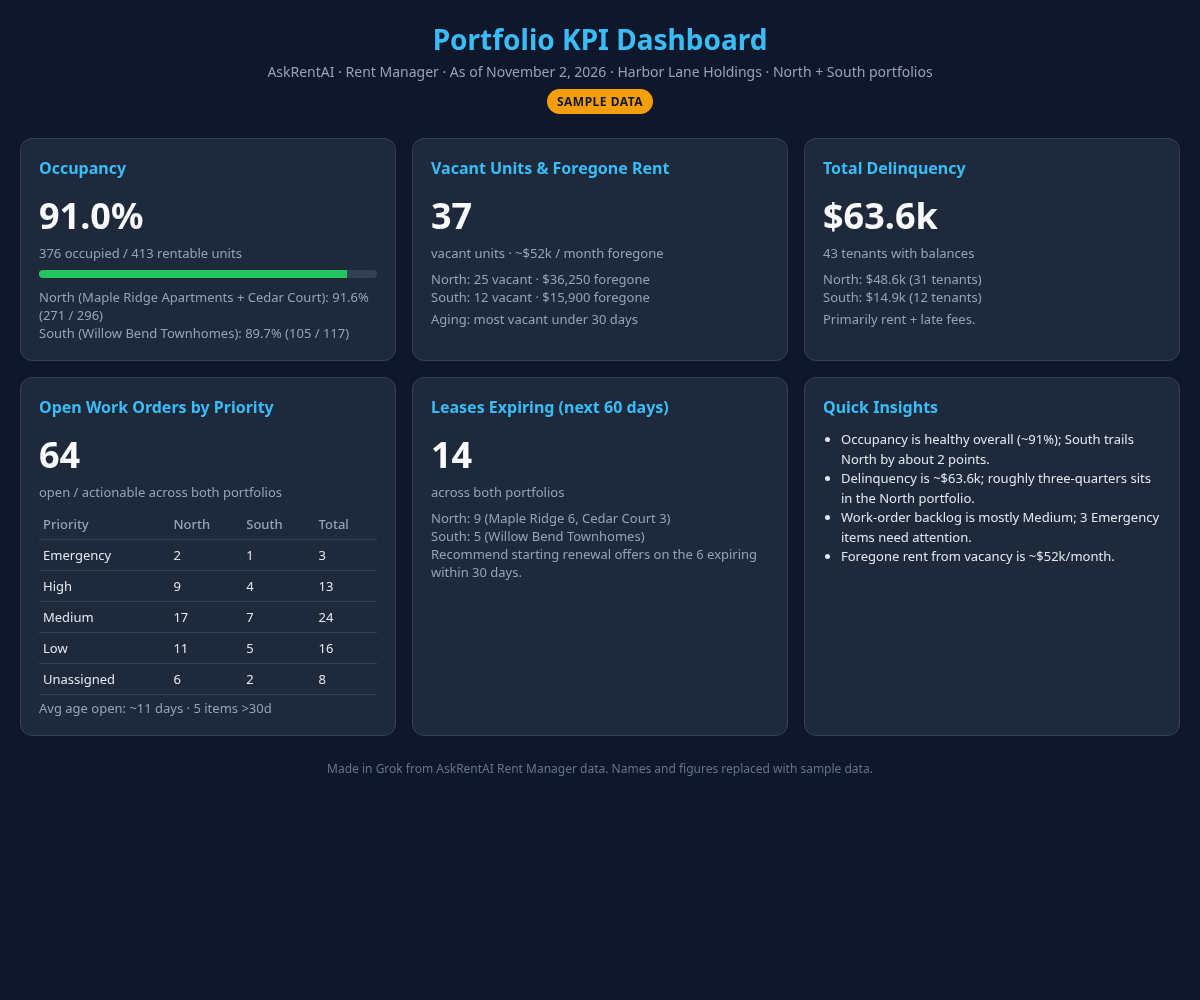
Portfolio KPI dashboard
One page covering occupancy, vacant units and foregone rent, delinquency, open work orders by priority and leases expiring soon. Grok drew the dashboard; AskRentAI supplied the Rent Manager data.
Exact prompt
Using my AskRentAI Rent Manager data, build me a one-page portfolio KPI dashboard as a visual artifact: occupancy, vacant units and foregone rent, total delinquency, open work orders by priority, and leases expiring in the next 60 days.
Made in GrokSample data
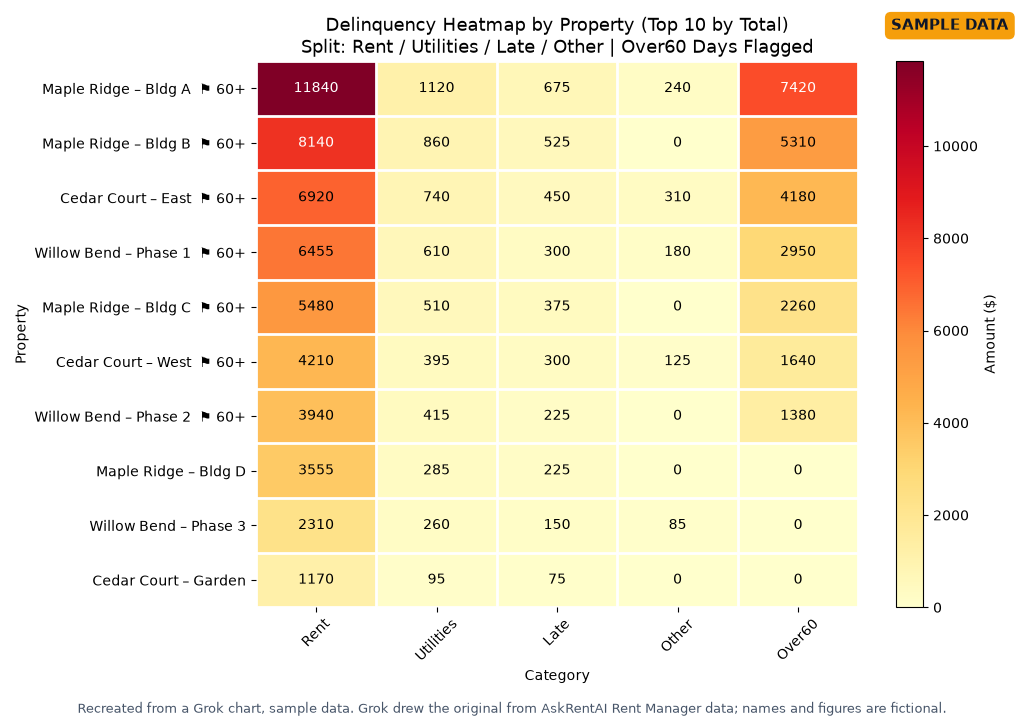
Delinquency heat map by property
Who is behind on rent, by property, split into rent, utilities and late fees, with anyone past 60 days flagged. See also the Rent Manager delinquency report guide.
Exact prompt
Using my AskRentAI Rent Manager data, show who is behind on rent as a visual heat map by property, split into rent, utilities and late fees, and flag anyone over 60 days.
Recreated from a Grok chart, sample dataSample data
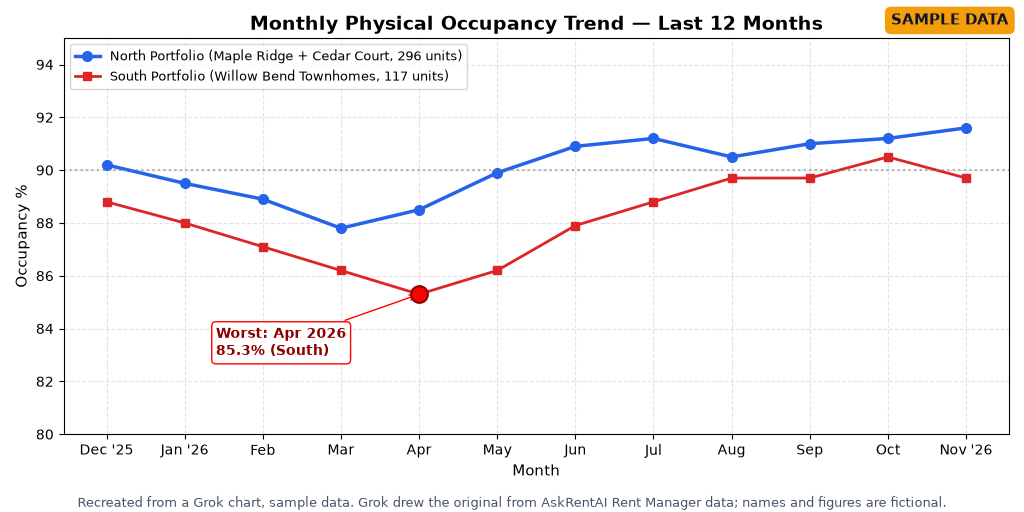
12-month occupancy trend
Monthly occupancy for the last twelve months, with the weakest month called out. The line chart shows two portfolios side by side.
Exact prompt
Using my AskRentAI Rent Manager data, chart monthly occupancy for the last 12 months and call out the worst month.
Recreated from a Grok chart, sample dataSample data
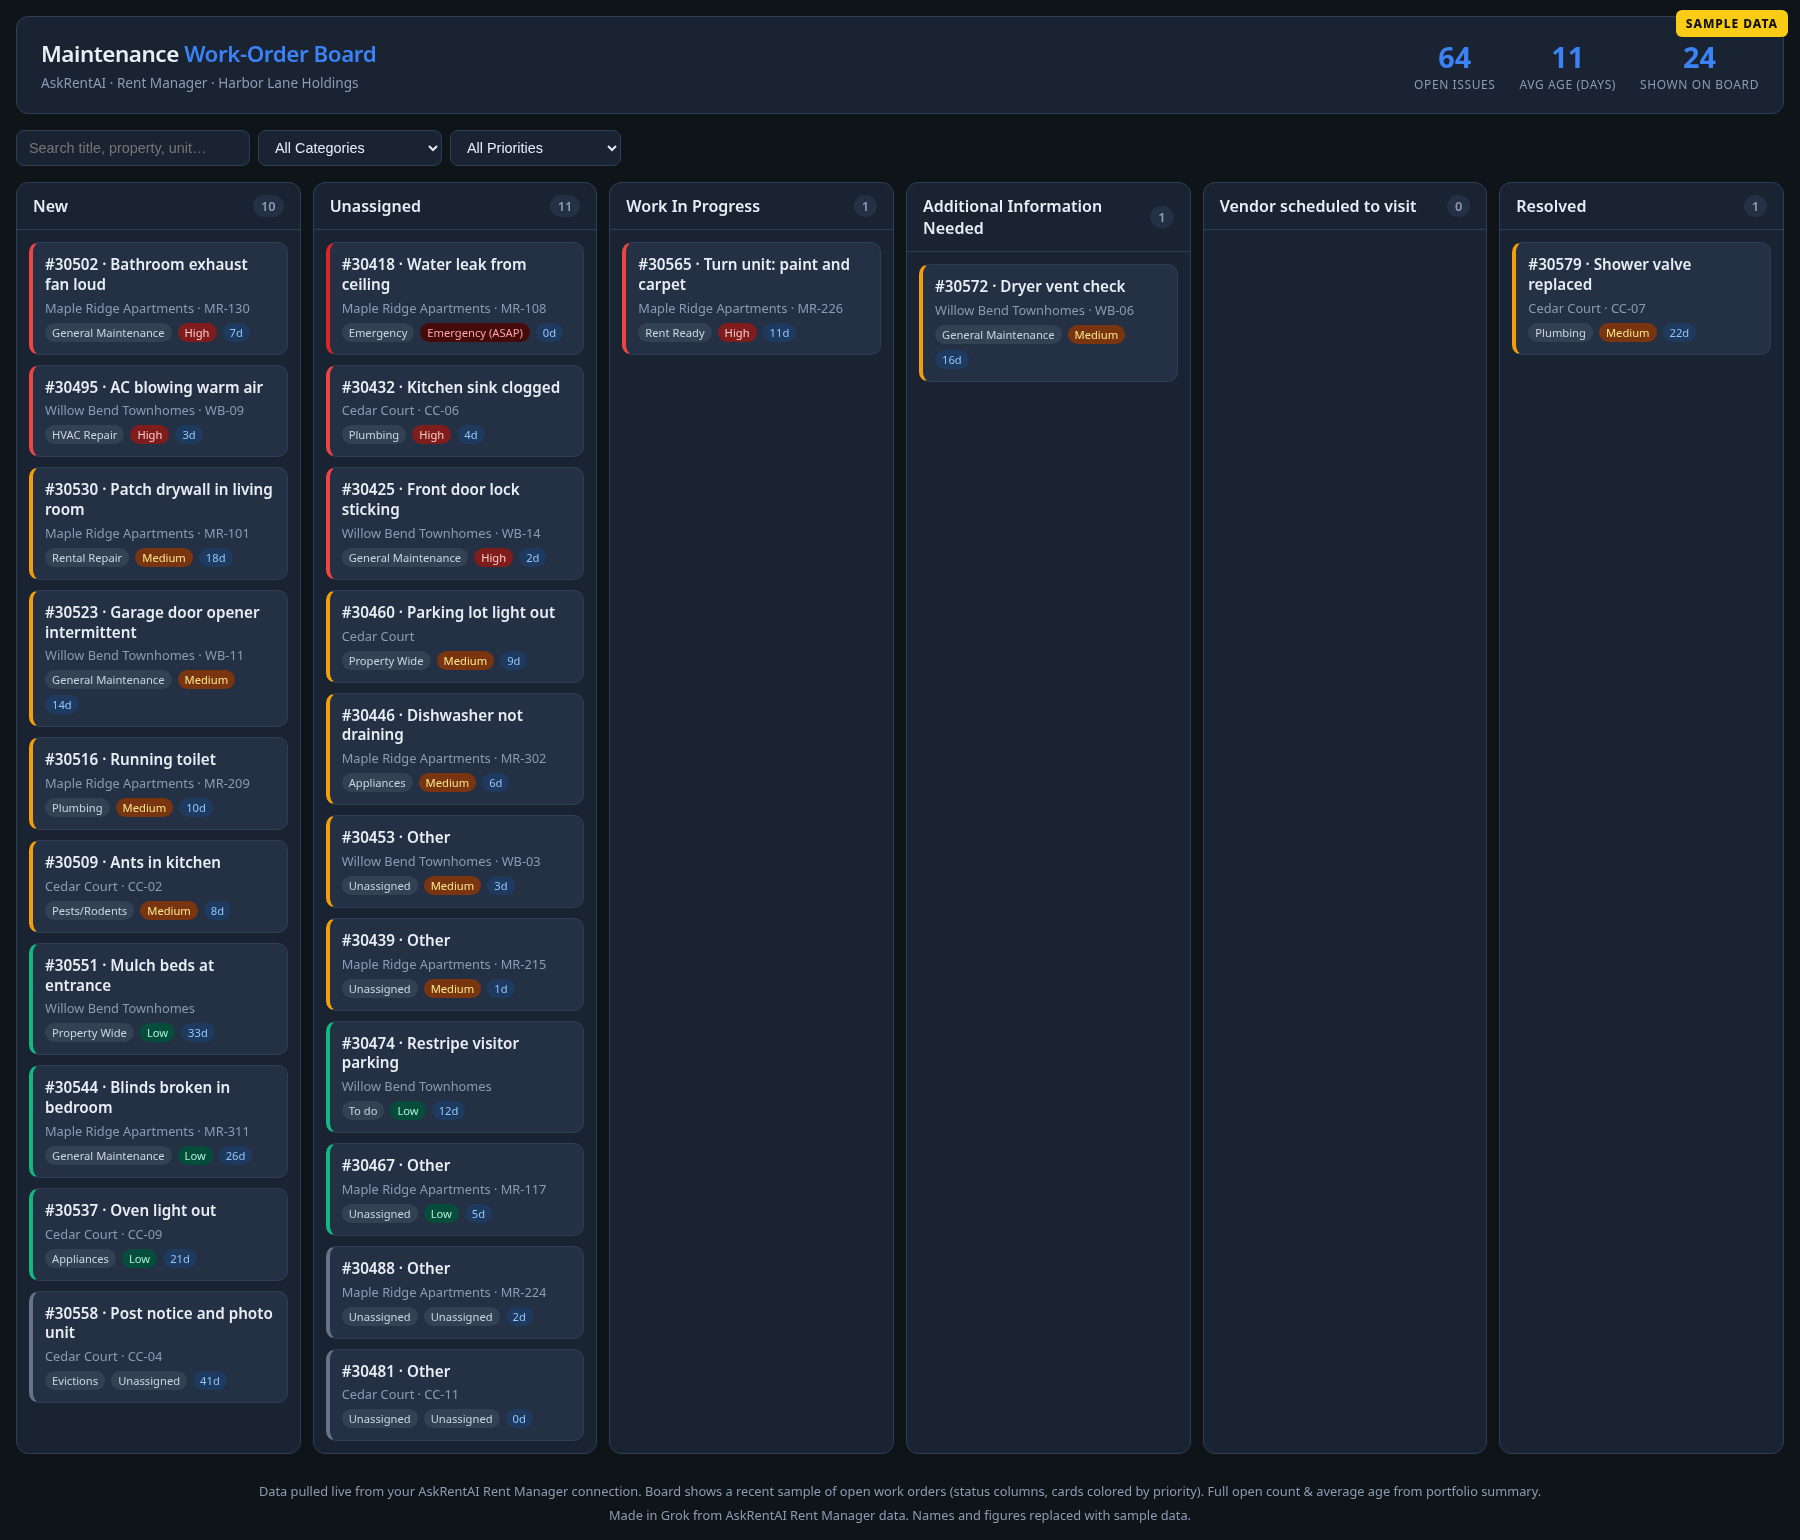
Maintenance work-order board
A kanban board of open maintenance issues by status, with cards grouped by category and priority and a header showing the open count and average age. Grok drew the board; AskRentAI supplied the Rent Manager data.
Exact prompt
Using my AskRentAI Rent Manager data, build a maintenance work-order board as an interactive HTML artifact: kanban columns by status, cards grouped by category and priority, and a header showing the count of open issues and their average age.
Made in Grok (minor fix applied)Sample data
Keep it current
Save the prompt that works for you. When you want new numbers, ask again, weekly or monthly, and your AI app draws a fresh version from your Rent Manager data as it stands that day.
Use Claude, ChatGPT or Grok
Rent Manager with Claude, ChatGPT or Grok all work through the same connection. Pick the setup guide for the one you use:
Connect your AI app to your Rent Manager data and try these prompts on your portfolio. Dashboards are included with $10 per user per month plus the AI app you already use. There is no separate BI or dashboard product to pay for.